


Understanding Your Dashboard and Reports
Learn how to use the Homeyhuts Dashboard to monitor bookings, occupancy, revenue, cancellations, and booking sources. This guide explains every section of the dashboard so you can easily track your property's performance and make informed decisions.
Understanding Your Dashboard and Reports
Your Homeyhuts Dashboard is your central command center. It gives you a real-time overview of how your properties are performing, including bookings, occupancy, revenue, and booking sources, all in one place.
By reviewing your dashboard regularly, you can track performance, identify booking trends, and make informed decisions to maximize your property's revenue.
Filters at the Top
Before reviewing any metrics, set your filters. The dashboard displays data based on the options you select.
Check-In Date
Select a date range to view bookings with check-ins falling within that period. By default, this is set to the last 30 days.
Property Filter
If you have multiple listings, use this dropdown to view data for all properties or a specific property. The total number of your active properties is shown in the selector (for example, All Properties (42)).
Key Metrics
These summary cards provide a quick snapshot of your property's performance during the selected period.
Avg Occupancy Rate
Shows the percentage of available nights that were booked during the selected period. A higher occupancy rate indicates stronger demand for your property.
Avg Occupied Nights
Displays the average number of nights each property was booked out of the total nights in the selected date range.
For example, 12 / 31 means each property was booked for an average of 12 nights out of 31 available nights.
Cancellations
Displays the total number of bookings cancelled during the selected period. Monitoring cancellations can help you identify patterns and take action if certain properties experience frequent cancellations.
Bookings Breakdown
This section shows how your bookings are distributed across different platforms and booking sources.
The circular chart displays the total number of bookings, divided into color-coded segments based on the booking source.
- Homeyhuts Direct: Bookings created using the Offline Booking form.
- Airbnb: Bookings received through your Airbnb listing.
- Goibibo / MakeMyTrip: Bookings received through your GoMMT listing.
- Calendar Block: Dates you have manually blocked on your calendar. These are not bookings but are included to show overall calendar usage.
Below the chart is a detailed table showing the following information for each platform:
- Bookings: Total number of reservations.
- Nights: Total number of booked nights.
- % Share: Percentage of your total bookings from that platform.
- Revenue: Total earnings generated during the selected period.
If you notice a high Calendar Block percentage, it means a large portion of your calendar is manually blocked. Reviewing these blocked dates may help improve occupancy if the property is available for bookings.
Daily Bookings Chart
The Daily Bookings chart shows your booking activity across the selected date range.
Each bar represents the number of bookings received on a particular day and is color-coded by booking platform.
Use this chart to:
- Identify days with higher booking activity.
- Understand which platform generated the most bookings.
- Spot seasonal demand, weekend peaks, or booking spikes during holidays and local events.
Bookings List
The bottom section of the dashboard displays a detailed list of all bookings.
Each booking includes:
- Booking ID: The unique reservation identifier.
- Amount: Total revenue for the booking.
- Platform: The booking source, such as Airbnb , Direct bookings , other ota's , etc
- Stay: Check-in date, check-out date, and total number of nights.
Pro Tip
Review your dashboard regularly to monitor occupancy trends, booking patterns, cancellations, and platform performance. Keeping an eye on these reports can help you make better pricing, availability, and marketing decisions to maximize your property's revenue.
Was this article helpful?
Related in Guides & FAQs
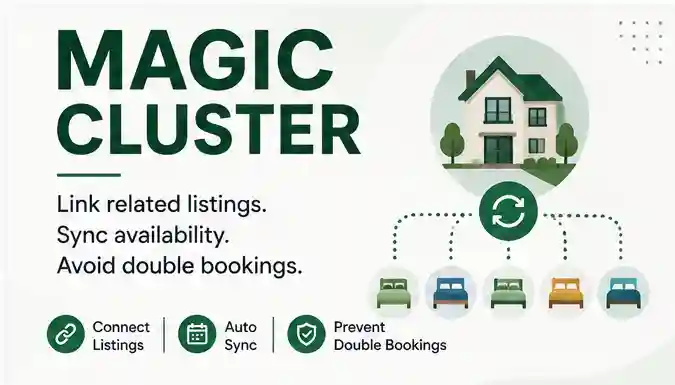
Magic Cluster: Link Multiple Listings & Prevent Double Bookings
Learn how to use Magic Cluster to connect your entire property and room listings, automatically synchronize availability, and prevent double bookings across all your connected OTAs.
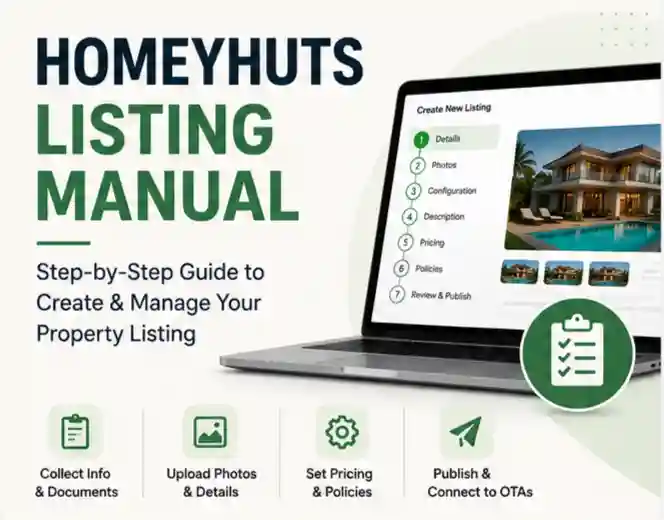
Homeyhuts Listing Manual: Create & Publish Your Propert
Follow this step-by-step guide to create a complete property listing on Homeyhuts. Learn how to add property details, upload photos, configure pricing and policies, publish your listing, and connect it with OTAs for seamless booking management.

How to Start an Airbnb or Homestay Business in India Without Owning a Property
Learn how to start an Airbnb or homestay business in India without owning property. Understand regulations, business models, platforms like Homeyhuts and essential skills. Ideal for aspiring hosts under the Incredible India scheme